The Favorites
Baylor (+250): The Bears are making a difficult schedule look easy. Baylor is 5-0 against ranked teams this season, winning by an average of 11.6 points per game and 24.2 points per game against all opponents. What can’t they do? Nothing, apparently – they’re second in scoring offense (87 points per game) and 20th in scoring defense (62.8 points allowed per game). Throw in top-10 marks in steals, assists, 3-point percentage, and field goal percentage, and you have the total package.
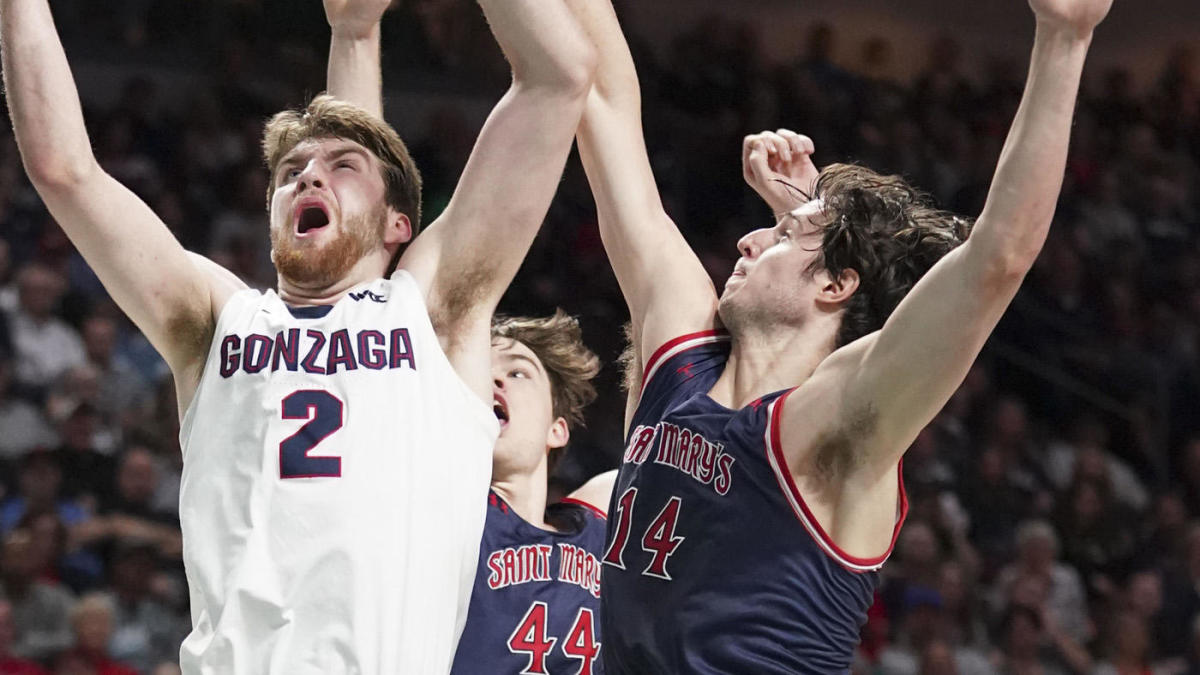
Gonzaga (+275): Gonzaga’s run over the past 10 years has been remarkable. They haven’t lost multiple double-digit games in a season since 2010-11 and are 22-0 this season thus far. They lead the nation in scoring (93.4 points per game is 6.4 points per game more than second place, Baylor) and scoring margin (+24.3 points per game). They’re also tops in field goal attempts per game and field goal percentage.
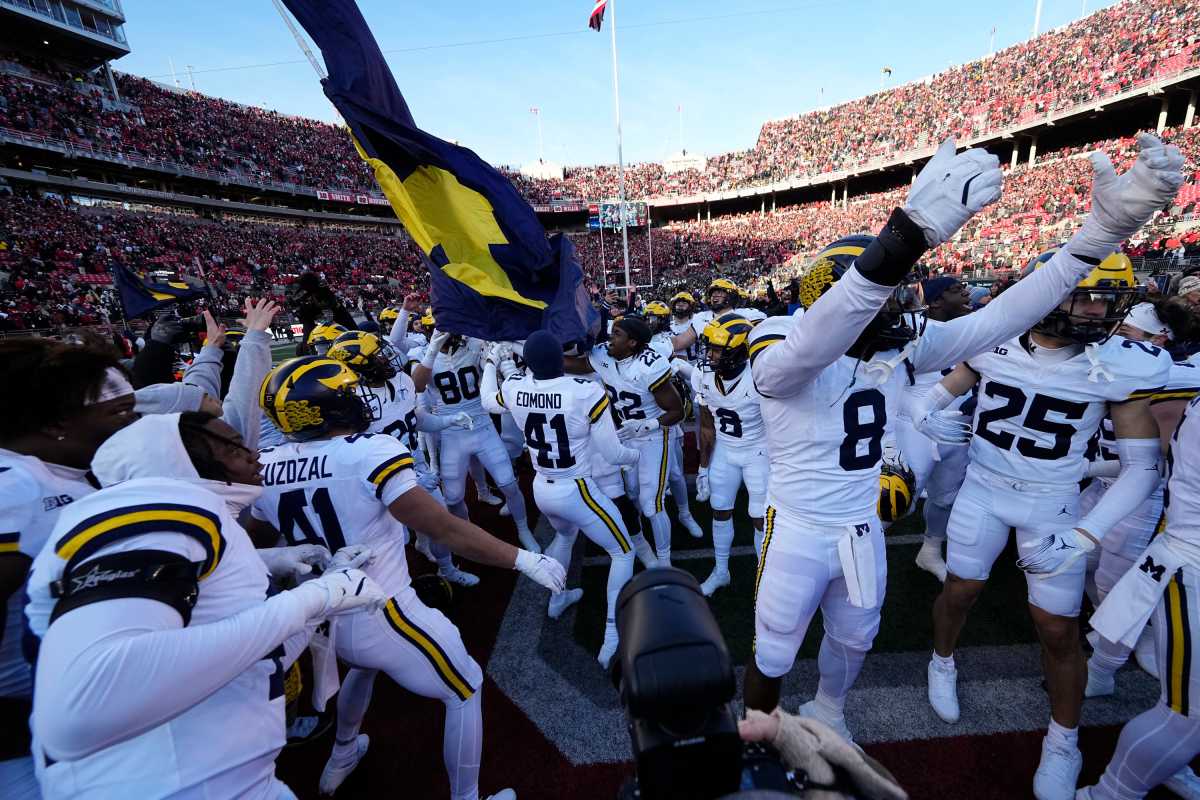
Michigan (+450): There were questions surrounding the Wolverines despite their 15-1 mark on the season before they went into Columbus and beat Ohio State in what might be the game of the year so far. Juwan Howard’s squad is getting it done in all facets. They’re fifth in the country in field goal percentage allowed, seventh in turnovers forced, and 13th in blocks.
The Next Group
Villanova (+1100): Jay Wright continues to win the way he’s done it for years – through taking care of the basketball and lighting it up around the 3-point line. They have five players averaging at least 10 points per game, a group that’s led by sophomore Jeremiah Robinson-Earl. This year’s team is looking similar to previous title winners in terms of their scoring offense and defense. Experience goes a long way in the NCAA Tournament.
Ohio State (+1100): The Buckeyes came up just short against arch-rival Michigan in one of the best college basketball games of the year. Duane Washington Jr. and E.J. Liddell have been terrific and one of the most lethal scoring duos in the country. They combined for 53 points in the loss and are both averaging over 15 points per game this season. While their metrics don’t jump off the page, this team is gritty and gets the job done; they’re 3-1 against ranked teams this season.
Houston (+1400): What makes Houston so deadly this season has been an impenetrable defense that’s second in points allowed per game (57.6), first in shots allowed per game (18.6), and first in field goal percentage allowed. They’re top-10 in eight different defensive metrics and have proven capable of blowing teams out of the water. They’re fourth in point margin (+16.6) and have won nine games by at least 20 points this season.
The Longshots
Iowa (+2000): Offensively, Iowa is a juggernaut. They’re third in the country in scoring, second in assists, and third in 3-point percentage behind nearly 25 points per game from star Luka Garza (best in the nation). Despite giving up the 243rd-least points per game, star players win games in the NCAA Tournament and Iowa has the best one in college basketball.
Alabama (+1800): Alabama’s offensive philosophy of jacking up as many 3s as possible is working. The Tide are in the top 10 behind nearly 81 points scored per game. The volume of 3s taken doesn’t require the most efficient shooting, as they are top-4 in 3s taken and made, but just 76th in percentage. Alabama is also a terrific rebounding team and has created plenty of turnovers this season. They can score a barrage of points in a hurry, making them an excellent candidate to pull off an upset come March.
Oklahoma (+2000): Austin Reaves is one of the nation’s best players behind 16.8 points, 5.5 rebounds, and 5.2 assists per game. He’s leading the Sooners through a gauntlet of a schedule in the Big 12 as all four conference “Ls” thus far have come to ranked opponents. Oklahoma is a likely 3 or 4 seed in the tourney at the moment.
HOW THE NCAA TOURNAMENT WORKS
March Madness is a 68-team, single-elimination tournament that annually crowns college basketball’s NCAA Division 1 men’s national champion.
The event is aptly named, considering it features a frenetic 67 games over a 19-day period. The participating schools are announced on “Selection Sunday”, along with the exact seeding and brackets.
The annual college basketball rite of spring is sports betting’s most prolific multi-day event. Below you’ll find the current betting odds for the favorites to win the NCAA Tournament, along with key tournament details and betting strategy to help you during the month-long madness.
The first 32 teams to gain entry into the tournament do so automatically by winning their conferences. The remaining 36 slots are filled by “at-large” teams. A 10-member selection committee consisting of athletic directors and conference commissioners undergoes an arduous and multi-layered process to determine the 36 at-large teams and subsequently finalize seeding and brackets.
This year, the committee will employ the NCAA Evaluation Tool (NET) as its primary sorting method for determining at-large entrants. The NET replaces the RPI (Rating Percentage Index), which had been utilized since 1981.
The NET utilizes the following metrics:
- Game results
- Strength of schedule
- Game location
- Scoring margin
- Offensive and defensive efficiency
- Quality of wins and losses
MARCH MADNESS BETTING HISTORY
The first NCAA basketball tournament took place in 1939 in Evanston, Illinois. Since then, 36 teams have won it all and five teams have won the tournament at least five times (Indiana, Duke, UNC, Kentucky, UCLA). Since seeding began in 1979, number-one seeds have won the tournament 24 times and have accounted for almost 49% of all championship appearances. Just three times has a team seeded lower than four won the title, and no team seeded below eighth has won, nor made a championship appearance.
Since betting lines were released for NCAA tournament games in 1985, underdogs have covered 44% of the time, winning outright 29% of the time. Games have gone under the total in 56% of games. Since 2010, games have gone under the total in 70% of games and favorites have covered in seven out of ten games. Three teams have won more than one championship since 2010 (Duke, UConn, Villanova), but none have won back-to-back titles (despite Butler & UNC appearing in back-to-back title games).
Since 2000, the top overall seed has made the championship game just four times but won the game three of those times (75%). In total, top overall seeds in the tournament have comprised of just 8% of the total Final Four teams (missed 13 out of 20 years). Besides 1-seeds, 2-seeds have the most championship appearances since 2000 (7 times), followed by 3-seeds (6 times), and 5- and 8-seeds (2).
Just eight percent (52/640) of all Sweet 16 teams have been seeded 11 or lower, and only 2.8% of teams in the Elite Eight were seeded 11 or lower. Four 11 seeds advanced to the Final Four (Loyola Chicago, 2018; VCU, 2011; George Mason, 2006; LSU, 1986). UMBC is the only 16-seed to upset a 1-seed in the tournament’s history (2018), and just eight 15-seeds have prevailed (5%). In 2015, two 15-seeds upset 2-seeds (25% of all such upsets) and two 14-seeds upset 3-seeds.
Using historical data when filling out brackets and betting March Madness, err caution; stats should be used in the long-run but when choosing individual games, be sure to study matchup statistics. The most important thing to remember, though, is this is March Madness, and anything can (and will) happen.
TOURNAMENT BETTING STRATEGIES
The historical ATS data for each team in tournament play is just one of countless data points that can constitute March Madness betting research. Other factors that can hold considerable relevance include:
- A team’s late-season performances, including in their conference tournament
- Key injuries
- A team’s defensive proficiency, as this typically has more carryover into tournament play than a high-powered offense
- “Fading the public” when the line appears to be significantly affected by a team’s popularity, as opposed to actual recent performance
- Examining various tournament-specific historical trends, such as how high-seeded mid-majors have done in each round in terms of straight-up wins and losses.
Below is an overview of historical first-round performance by seeds 1-16 against the number:
| Seed | Wins | Losses | Pushes | Win % |
|---|---|---|---|---|
| 1 | 27 | 25 | 0 | 51.92 |
| 2 | 22 | 27 | 3 | 44.90 |
| 3 | 28 | 24 | 0 | 53.85 |
| 4 | 28 | 23 | 1 | 54.90 |
| 5 | 22 | 29 | 1 | 43.14 |
| 6 | 22 | 29 | 1 | 43.14 |
| 7 | 29 | 22 | 1 | 56.86 |
| 8 | 27 | 22 | 3 | 55.10 |
| 9 | 22 | 27 | 3 | 44.90 |
| 10 | 22 | 29 | 1 | 43.14 |
| 11 | 29 | 22 | 1 | 56.86 |
| 12 | 29 | 22 | 1 | 56.86 |
| 13 | 23 | 28 | 1 | 45.10 |
| 14 | 24 | 28 | 0 | 46.15 |
| 15 | 27 | 22 | 3 | 55.10 |
| 16 | 25 | 27 | 0 | 48.08 |